
About the 2016 National Health and Nutrition Survey results
With the 2016 National Health and Nutrition Survey, emphasis was placed on understanding regional disparities related to physique and lifestyle habits as well as to the estimate of the number of people suffering from diabetes. Households in a total of 475 districts, 10 districts per prefecture (15 districts only in Tokyo, which has a large population), were randomly selected from the 2010 census tracts with a suffix number of "1" (general survey tracts). Household members who were 1 year of age or older as of November 1, 2016 were surveyed. Thirteen districts were excluded due to the effects of the Kumamoto Earthquake in April 2016, Typhoon No. 10 in August, and the Tottori Prefecture Chubu Earthquake in October.
For the full details of the survey, please see the Ministry of Health, Labour, and Welfare's 2016 National Health and Nutrition Survey Report.
Also, the data used on these maps can be downloaded from e-Stat, the portal site for government statistics.
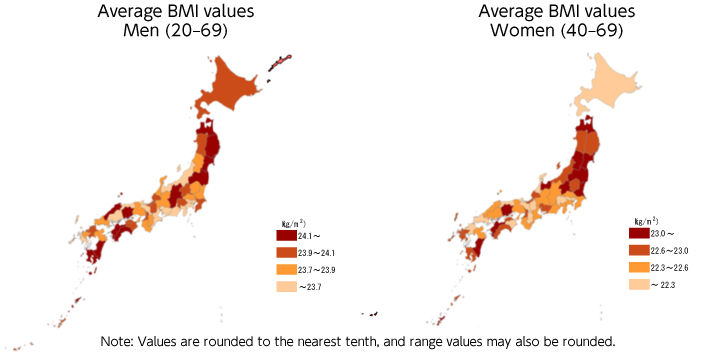
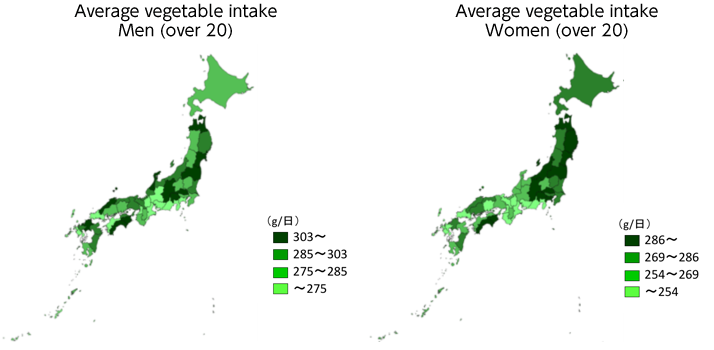
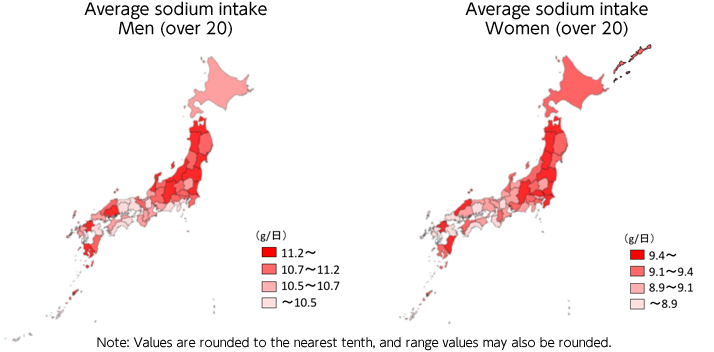
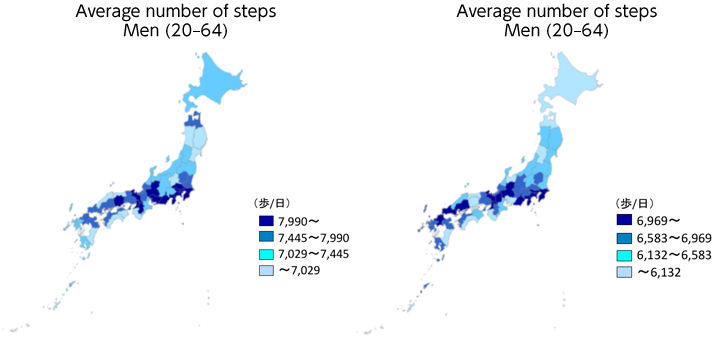
Physique (BMI), vegetable intake, sodium intake, steps, and smoking rate (men only) values for each prefecture have been adjusted for age and sorted according to four ranges, from highest to lowest. The relative error for smoking rates among women was considerably high, so those results are not displayed. Significant variation was not observed between the top 25% and bottom 25% for any of the survey items.
Note: Average BMI values and sodium intakes are rounded to the nearest tenth, and their range values may also be rounded.
Average BMI values
Average vegetable intake
Average sodium intake
Average number of steps
Percentage of men (over 20) who currently smoke regularly
