
Improvement rates of target indicators by prefectures
Information on health promotion plans of each prefecture, published by May 31, 2019, was obtained from the website of each local government.(1)
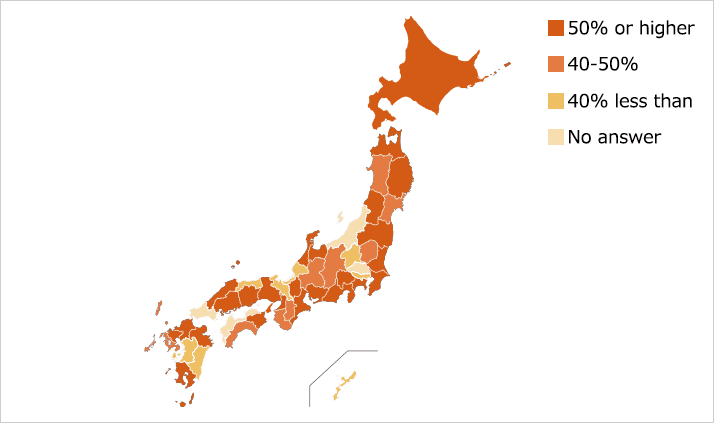
The improvement rate was higher than 50 % in 25 prefectures.
The improvement rate was calculated by the following formula;
improvement rate (%)=the number of improved target indicators/ the number of total target indicators×100.
Basically, priority was given to the information provided by local government. However, the assessment methods were different for each government. Thus, if the indicator value at the interim evaluation was closer to the target value compared to the baseline value, it was considered as “improved”.
The best 5 prefectures for improvement rate
| Prefecture | Title of Prefectures Health Promotion Plans | Total number of target indicators | The number of indicators with an improvement | Improvement rate |
|---|---|---|---|---|
| Tokushima | Health Tokushima 21 | 62 | 44 | 71.0 |
| Hyogo | Hyogo Health Promotion and Implementation Plan | 47 | 32 | 68.1 |
| Shiga | Healthy and Active 21 ~Healthy Shiga Promotion Plan | 53 | 36 | 67.9 |
| Ishikawa | Ishikawa Health Frontier Strategy | 58 | 37 | 63.8 |
| Iwate | Health Iwate 21 Plan (the second term) | 60 | 38 | 63.3 |
The best 10 targets for improvement rate
The indicators with higher improvement rate, such as participation rates of health checkups, tend to be related to improvement of socioenvironmental factors.
| Target indicators | The number of prefectures to set the indicator | The number of prefectures with improvement of the indicator. | Improvement rate |
|---|---|---|---|
| Over 80% of 3-year-old children have no dental caries | 45 | 40 | 88.9 |
| Reduction in suicide rate. | 42 | 36 | 85.7 |
| 12-year-old children have less than 1 dmft ( the mean decayed, missing, and filled teeth) | 45 | 38 | 84.4 |
| Increase in percentage of individuals who participated in dental check-up during the past year | 40 | 33 | 82.5 |
| Increase in number of corporations that deal with health promotion and educational activities |
15 | 12 | 80.0 |
| Reduction in age-adjusted mortality rate of cerebrovascular disease (CVD) and ischemic heart disease (IHD) | 44 | 35 | 79.5 |
| Increase in percentage of 80-year-old individuals with over 20 teeth remaining | 44 | 34 | 77.3 |
| Reduction in number of definite and at-risk people with metabolic syndrome | 44 | 11 | 25.0 |
| Increase in participation rates of specified health checkups and specified health guidance | 43 | 30 | 69.8 |
| Reduction in complications (number of patients newly introduced to dialysis due to diabetic nephropathy) | 42 | 20 | 47.6 |
The indicators with lower improvement rate
The indicators with lower improvement rate tend to be indicators that were set for individuals.
| Target indicators | The number of prefectures to set the indicator | The number of prefectures with improvement of the indicator. | Improvement rate |
|---|---|---|---|
| Increase in consumption of vegetables and fruits | 47 | 10 | 21.3 |
| Increase in percentage of individuals maintaining ideal body weight (Reduction in percentage of obese individuals [BMI 25 and more] and underweight individuals [BMI less than 18.5]) |
44 | 7 | 15.9 |
| Increase in percentage of individuals who eat balanced diet with staple food, main dish and side dish more than twice a day | 28 | 4 | 14.3 |
| Reduction in percentage of individuals who do not take rest through sufficient sleep | 47 | 5 | 10.6 |
| Increase in daily number of steps | 45 | 2 | 4.4 |